
Rapid Electrochemical Assessment of Paint
Introduction
The Rapid Electrochemical Assessment of Paint (REAP) is a procedure designed to estimate the long-term corrosion resistance of coated metals using short term electrochemical tests. It involves running a series of experiments over a 24-hour period on two or more samples. At the end of the experiments the data is analyzed to extract three parameters.
You can use the REAP parameters to estimate the relative time to failure (TTF) of coatings and rank coatings in terms of their expected long term performance. Another application of REAP testing is the quality control of coated products. You can follow the variation of the REAP parameters over time, as a measure of coating quality. An overview of the REAP process can be seen in figure 1.

Figure 1: Outline of the REAP testing procedure
The REAP technique requires knowledge of corrosion measurements, a basic understanding of EIS, and also how to fit a model to EIS data. It recommended you do not continue until you have a grasp of these concepts.
Overview of REAP Testing
Measurement of the REAP parameters involves tests on at least two painted metal samples. One of the samples is scribed with a 2x2 cm right angle cross.3 Both samples are exposed to a 0.5M aqueous NaCl test solution at room temperature for 24±2 hours. An overview of the testing process with two samples is illustrated above.
Immediately after filling the cells, the corrosion potential of the unscribed painted sample is measured. The measured potential determines the DC potential used in the electrochemical impedance spectroscopy (EIS) experiments on the sample. An EIS experiment is run immediately after the corrosion potential experiment. A second EIS experiment is run after soaking the unscribed sample in the NaCl test solution for 24 hours.
In between the two EIS tests, a 24-hour potentiostatic experiment is run on the scribed sample. A cathodic potential (-1.05V vs. SCE) is used to accelerate disbonding of the coating. This test measures one of the REAP parameters, the disbond rate of the coating (dx/dt), in units of mm per hour. Typical rates measured via cathodic disbonding are 0.1mm/hr or lower.
Comparison of the results of the two EIS experiments allows you to evaluate the second REAP parameter, water uptake by the coating. Water uptake is expressed as an apparent volume fraction, %v. % v is calculated from the change in the measured capacitance of the coating (CC) over the 24 hour period. These capacitance values are obtained via analysis of the EIS data using an equivalent circuit model, seen in figure 2.

Figure 2: Simplified REAP electrical circuit model
The third REAP parameter is obtained from the EIS data recorded after 24 hours. It is the corrosion resistance (Rcor) of the underlying steel and results directly from the equivalent circuit analysis of the EIS data.
Background
The procedure described in this application note is a condensed summary of a proposed method being considered by the American Society for Testing Materials (ASTM). The ASTM G01.11 subcommittee on Electrochemical Measurements in Corrosion Testing used an article by Kendig et. al.1 as the basis of the proposed method for testing painted steel.
Kendig’s paper studied the correlation of various electrochemically-measured parameters with the long-term time to failure (TTF) of painted carbon steel samples. TTF was evaluated by exposure to a salt fog.2. The three parameters mentioned above were found to correlate well with the TTF. The rapid electrochemical assessment method does not attempt to measure the time to failure directly. Instead it relies on the correlation of the TTF with REAP parameters as demonstrated in the Kendig paper.
This application note is a description of the REAP testing process using Gamry’s products rather than a detailed review of the original paper or the proposed ASTM method. More information can be obtained from the paper or the ASTM proposal.
Cell Design & Setup
Each REAP measurement requires two electrochemical cells. The proposed REAP method calls for five replicate tests requiring the use of 10 samples. In most cases, you will want to run the replicate tests simultaneously, so ten cells are needed.
 If you wish to build your own cells, the proposed REAP method describes a cell that holds a flat painted metal sample. This cell exposes 56 cm2 of the specimen to the electrolyte. The reference electrode is a saturated calomel electrode (SCE), while the counter electrode can be platinum, gold, graphite, nickel or passivated stainless steel. Graphite rods are probably the most economical choice. As mentioned above the test solution used is a 0.5 M NaCl solution and the experiments are performed at room temperature.
If you wish to make use of a ready made cell kit, you can consider commercial cell kits from a number of vendors. Gamry’s PTC1 (Paint Test Cell) is designed to be inexpensive and easy to use. It can be seen in figure 3.
The PTC1, shown, consists of a simple glass tube that clamps onto a flat metal specimen. A rubber O-ring is used to create a watertight seal. The top is a rubber stopper with holes suitably sized for the reference & counter electrodes. The base is polypropylene. The PTC1 comes with an SCE reference electrode & a graphite rod counter electrode. The sample exposed in the PTC1 is 4.3 cm in diameter for an area of 14.6 cm2.
Although neither the REAP paper or proposed method mentions it, you will also want to run your EIS tests in a Faraday cage. A Faraday cage is a metal enclosure that shields the cell from noise. Shielding is required for accurate EIS tests on very good coatings. A Faraday cage can be as simple as a cardboard box lined with aluminum foil. Make sure that the Faraday cage does not come in contact with any of the cell electrodes. You must also connect the black ground lead from the cell cable to the cage, and ensure your potentiostat is earth grounded.
The experiments are standard techniques, which can be carried out using Gamry’s software and any Gamry potentiostat with EIS capability. Note that Gamry’s Reference 600 potentiostat is very well suited for EIS on high impedance coatings. The Reference 3000 Potentiostat, while it is less sensitive, is also a good choice. The Interface 1000, on the other hand, may have difficulty making EIS measurements on high quality, thick coatings.
Experiments
1. Run Corrosion Potential Experiment on the Unscribed Sample.
The first experiment to be performed is just a corrosion potential or open circuit vs. time experiment. Look for “Corrosion Potential” on the DC Corrosion Software submenu in the Experiment pulldown menu and select it. You will be presented with a setup dialog box like the one shown below. Use the settings shown in figure 4. These are the default values except for the Output File and the Stability parameter (shown set to 0).
Hook up the cell with the unscribed painted sample and then click on the OK button to start the experiment. The whole purpose of this step is to determine the DC Voltage setting to be used in the EIS experiments. If the open circuit readings are stable, the EIS experiments will be run at 0 V vs. Eoc.
If your metal sample has a very good coating, the coating will have a very high resistance and may approach the behavior of an ideal insulator. If this happens, the open circuit potential will drift to very high potentials with time. In this case, you cannot use the open circuit potential as the DC Voltage setting in the EIS experiments. The proposed REAP method uses a potential of -600 mV vs. SCE when the open circuit potential is not stable.
When the experiment is finished, click on the F2-Skip button to close the experiment window.

Figure 4: Settings for Corrosion Potential Experiment
2. Run EIS on Unscribed Sample Before 24 Hour Soak Test.
Next you will run a Potentiostatic EIS experiment on the same cell used for the open circuit test. Look for Potentiostatic EIS on the Electrochemical Impedance Spectroscopy Software submenu on the Experiment pulldown and select it. You will be presented with a setup dialog box like the one shown in figure 5.

Figure 5: Settings for EIS Experiment Before 24 Hour Soak Test
Use the settings shown above. If an unstable open circuit potential was determined in Step 1, change the DC Voltage setting to -600 mV vs. Eref.
Remember to update the Area setting to the correct value for the cell you are using — 14.6 cm2 for the PTC1. The proposed method recommends allowing the painted sample to equilibrate for 10 minutes. For this reason the Initial Delay setting is On and the Time is set to 600 s. Do not use the F2-Skip key to bypass the Initial Delay.
Simply hook up the cell with the unscribed painted sample and click on OK to start the experiment. After the experiment has finished, use F2-Skip to close the experiment window.
3. Run Potentiostatic Test on Scribed Sample for 24 Hours.
Disconnect the cell with the unscribed painted sample, but leave the cell filled with the solution for the 24 hour soak test. Next hook up the cell with the scribed painted sample. Use the Experiment pulldown menu to bring up a Potentiostatic experiment setup dialog box from the DC Corrosion menu. This is seen in figure 6.
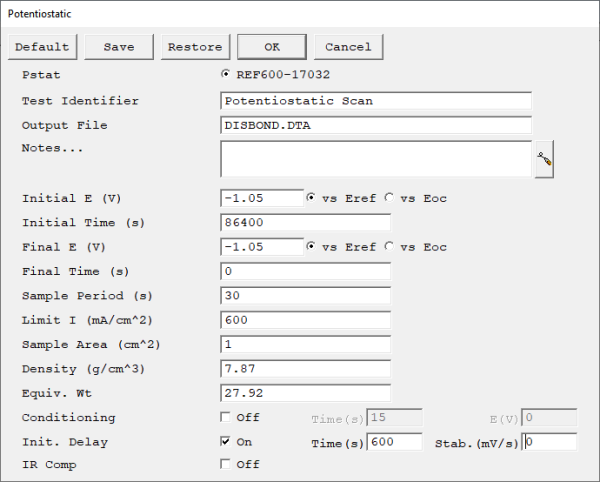
Figure 6: Settings for Potentiostatic Cathodic Disbonding Test
A Potentiostatic experiment setup dialog box will appear. Use the experiment parameters shown above in figure 6. When you are done, click on OK to start the experiment. The data actually collected during this 24 hours of cathodic disbonding is not used for data analysis, but in general higher currents seen in this experiment will lead to higher disbond rates. At the end of the experiment, click on F2-Skip to close the experiment window.
4. Run EIS on Unscribed Sample After 24 Hour Soak Test.
After the 24 hour cathodic disbonding is over, disconnect the cell with the scribed sample and hook up the cell with unscribed sample again. Start up another Potentiostatic EIS experiment and use the parameters shown in figure 7. Make sure the DC Voltage setting is the one used in Step 2.
If you wish, you may change the Final Freq. to values lower than 0.01 Hz, but 0.01 Hz is a good compromise between usefulness and time taken to collect the data. Remember to update the Area setting to the correct value for the cell you are using.

Figure 7: Settings for EIS Experiment After 24 Hour Soak Test
Click on OK to start the experiment. After the experiment has finished, use F2-Skip to close the experiment window.
Data Analysis
5. Perform Tape Pull on Scribed Sample. Measure Disbond Rate (dx/dt).
")
After the potentiostatic test has run for 24 hours on the scribed painted sample, you need to measure the disbond rate, dx/dt. Remove the scribed sample from the cell. Immediately rinse the sample with deionized water. Remove excess water with a lint-free cloth or paper towel. A piece of adhesive tape is applied to the region around the scribe and pulled to remove any loose coating around the scribe. Probe the remaining coating with a knife edge to make sure that the loose material has been completely removed by the tape pull.
Use a ruler to measure the width of the tape pullback area. You should to measure this width in several places and average the results. The disbond rate is the average width of the disbonded stripe divided by two times the elapsed time. Kendig’s paper uses a default value of .0010 mm/hr whenever no appreciable pullback was observed.
6. Analyze EIS Data Using REAP2CPE.MDL. Extract CC,0, CC,24 & Rcor.
As mentioned before, analysis of the REAP impedance data is accomplished using an equivalent circuit suitable for a coated sample. The circuit shown here differs from the one shown in the introduction in that the capacitors have been replaced by constant phase elements. This circuit is contained in the model file, REAP2CPE.MDL, shown in figure 8. Using constant phase elements (imperfect capacitors) can give a better fit to experimental data. Fit this model using the Simplex Method, located under the “Impedance Tab” in Analyst.

Figure 8: REAP2CPE.MDL used in Analysis of EIS data.
You will be presented with a dialog box shown below which requests starting values for the model parameters. You need to enter realistic estimates for these values, but they don’t have to be exact, just in the same ballpark. Some suggested values are shown below.
Note that n and m are shown as locked parameters. You will probably get better results if you run the calculation first with n and m locked and then run the calculation a second time letting them vary. Use the “Autofit” option to fit the model.

Figure 9: REAP2CPE.MDL Parameter Setup Dialog Box
If the fit does not converge to reasonable values and the theoretical curve does not closely fit the experimental data, you need to vary the starting values. Resistance values are entered in ohms and the capacitances in farads.
Next open and fir the reap2cpe.mdl to the EIS24HRS.DTA file.
You might want to use the numbers that result from the EIS data at 0 hours as the starting point for the fit for the EIS data taken after 24 hours.
By fitting both the EIS data taken before and after the 24 hour soak test of the painted unscribed sample, you now have the coating capacitance at 0 and 24 hours (CC,0 & CC,24) and the corrosion resistance, Rcor. For Rcor, use the value obtained from the EIS data after the 24 hour soak test.
7. Calculate Coating Water Uptake, %v.

Once you have extracted the coating capacitance from the EIS data, you can use the formula above to estimate the water uptake of the coating as a volume percent. Note that the capacitance values are expressed as 1/Cc rather than Cc, due to the use of CPE’s. The formula used in the proposed REAP method is equivalent (shown below):

8. Predict Relative Time To Failure (TTF)
The last step in REAP testing is to interpret the numbers. Ideally, you would like to simply take the three REAP parameters measured and combine them into a single value that can predict time to failure values.
Kendig et. al. did that by analyzing the long term tests on carbon steel samples exposed to a salt fog. They had two different criteria for determining TTF. They found the REAP parameters correlated best with the TTF determined from the pullback scribe tests. They came up with the following formula to predict the pullback TTF from the measured values of the three REAP parameters:
![]() These numbers result from linear regression of the pullback TTF values with the REAP parameters for the specific mild steel samples used. These numbers may not apply to other metal samples and probably depend on other factors such as the test solution and cell used. Determination of the true value of these predictive constants for another system would require long term testing to determine the TTF values for that metal system. In general, though, the formula shows that higher values of dx/dt and %v lead to shorter time to failure, while higher Rcor values lead to longer time to failure.
These numbers result from linear regression of the pullback TTF values with the REAP parameters for the specific mild steel samples used. These numbers may not apply to other metal samples and probably depend on other factors such as the test solution and cell used. Determination of the true value of these predictive constants for another system would require long term testing to determine the TTF values for that metal system. In general, though, the formula shows that higher values of dx/dt and %v lead to shorter time to failure, while higher Rcor values lead to longer time to failure.
If the REAP method is applied to a painted metal sample and then a single component of the system is varied, you can predict the effect of the change on the TTF for the system. For example, comparison of the REAP parameters for several different coating materials for a given alloy and test solution could lead to noticeable differences in the disbond rate. Assuming the water uptake and corrosion resistance did not change appreciably, the best coating would be the one with the lowest disbond rate.
If you need more detailed background information after reading through this application note, it is suggested that you obtain copies of the proposed ASTM method and/or the original Kendig paper. As always, if you have questions concerning the use of Gamry’s products, feel free to give us a call at 215-682-9330.
Contacting ASTM
If you wish to contact ASTM directly to obtain more information about any of their standards or current proposals, they can be reached at:
ASTM
100 Bar Harbor Drive
West Conshohocken, PA 19428-2959
Tel: 610-832-9585
FAX: 610-832-9555
Internet: http://www.astm.org
References
1Kendig, M., Jeanjaquet, S., Brown, R., Thomas, F., J. Coatings Tech., 1996, 68, 39-47.
2ASTM B117 describes salt fog testing.
3ASTM D1654 describes a procedure for scribing a sample.
Want a PDF version of this application note?
Please complete the following form and we will email a link to your inbox!
Categories

