
Thermodynamics of Corrosion: Degradation Entropy Generation
Lijesh Koottaparambil1 and Michael M. Khonsari1
1Department of Mechanical and Industrial Engineering, Louisiana State University, Baton Rouge, Louisiana 70803, USA
Introduction
Electrochemical techniques are extensively employed for corrosion characterization owing to their ability to provide time-resolved, quantitative descriptions of interfacial degradation processes at the metal–electrolyte boundary. Conventional corrosion descriptors, including corrosion current density, polarization resistance, and gravimetric mass loss, provide effective means for comparing materials under controlled conditions. However, their dependence on environmental and electrochemical parameters—such as electrolyte composition, temperature, applied potential, and exposed surface area—limits their generalizability.
From a thermodynamic perspective, corrosion is an irreversible electrochemical degradation process governed by oxidation and reduction reactions that dissipate energy. In accordance with the second law of thermodynamics, such irreversible processes necessarily entail entropy generation. As a result, corrosion-induced material degradation is intrinsically linked to entropy production, rendering entropy a physically meaningful metric for characterizing corrosion damage. Exploiting this fundamental relationship, the present application note adopts a thermodynamically grounded framework based on the Degradation Entropy Generation (DEG) theorem [1]—a general theory that establishes a direct proportionality between entropy generation and material degradation for systems under a given dissipative mechanism. Under this framework, the rates of degradation and entropy generation remain proportional, and their ratio—defined as a material-specific degradation coefficient (B)—remains invariant across varying operating conditions, provided the degradation mechanism does not change. By correlating electrochemical energy dissipation measured during potentiostatic corrosion experiments with experimentally observed material loss, this approach enables corrosion behavior to be quantitatively characterized, compared, and predicted across a broad range of materials tested under different environmental and electrochemical conditions using the a simple potentiostat.
Degradation Entropy Generation (DEG) Theorem
In the generalized formulation of the DEG theorem [1], a dissipative degradation process  produces a non-negative entropy generation
  . Let
. Let  denote the associated measure of degradation rate due to
  Thus,
Thus,  is a cumulative, non-negative function of a variable . Variable describes a dissipative mechanism such as work and depends on time-dependent phenomenological variables
  . The rate of degradation and entropy generation rate can be determined using the chain rule:
  (1)
(1)
where X is the thermodynamic force that derives or acts on the system and J is its conjugate thermodynamic flux (flow). Y stands for the force that degrades the system at the same flux J. Therefore,  (2)
(2)
Considering that  is mutual in both degradation rate and entropy rate in Eq. 1, the degradation coefficient can be defined as:
  (3)
(3)
Parameter  evaluates how entropy generation and degradation interact and should be a non-negative coefficient. Now combining Eq. 1, Eq. 2, and Eq. 3, the relation between degradation rate and entropy generation can be obtained as:
  (4)
(4)
Eq. 4 suggests that there is a direct relation between degradation rate and irreversible entropy generation using the degradation coefficient . Eq. 4 can be represented in the form of total degradation  and entropy generation
  until time t, as depicted in Eq. 5.
  (5)
(5)
During the accelerated corrosion experiment, the degradation w represents the volumetric material loss over time  (in seconds). The corresponding entropy generation is determined by
  in joules per kelvin (J/K) [17]. Here i is the corrosion current (in amperes), EOCP is the open circuit potential (in volts), E is the applied potential (in volts), and T is the system temperature (in kelvin). Therefore, the equation of B is expressed in
  :
:  (6)
(6)
Cell Design & Setup
Corrosion experiments were conducted using a standard three-electrode electrochemical cell consisting of a specimen with a defined exposure area as the working electrode, a graphite counter electrode (6.25 mm diameter and 100 mm length), and an Ag/AgCl reference electrode, with a 3.5 wt.% NaCl aqueous solution serving as the electrolyte (see Figure 1). All tests were performed under potentiostatic control at room temperature using a Gamry potentiostat/galvanostat/ZRA (Interface 1010E). After immersion, the working electrode was allowed to reach a stable open-circuit potential, after which a constant potential was applied relative to the reference electrode, and the resulting corrosion current was continuously recorded at a sampling rate of 1 Hz for a desired duration. After each test, the specimen was removed, cleaned, and weighed using a digital balance with an accuracy of 0.1 mg. The measured mass loss was subsequently converted to volumetric material loss using the known material density, providing a quantitative measure of corrosion-induced degradation. The degradation coefficient, , is determined from the measured current, OCP, and system temperature across multiple applied potentials. Further details of the experiments and results can be found elsewhere [2].
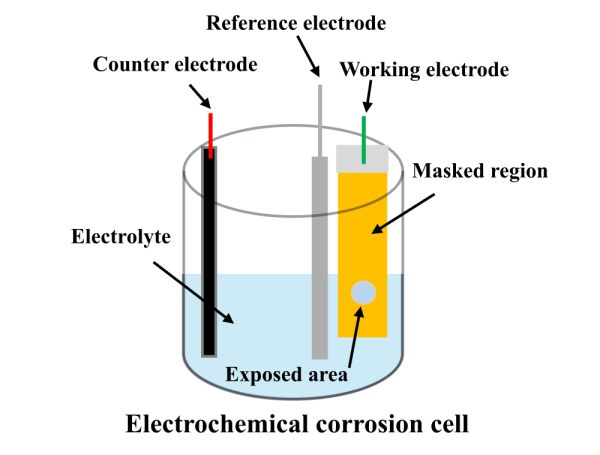 Figure 1: A schematic of a three-electrode electrochemical corrosion cell highlighting the working, reference, and counter electrodes.
Selection of Experimental Parameters and Applicability of DEG
The application of the DEG theorem requires careful selection of electrochemical parameters to ensure that a single, well-defined degradation mechanism governs material loss. In the present work, DEG is applied under conditions of uniform corrosion, where degradation proceeds relatively evenly over the exposed working surface and is directly linked to continuous electrochemical energy dissipation. The applied potential should be chosen such that the corrosion mechanism remains steady throughout the test duration. Potentials within the active dissolution or stable passivation regimes are suitable, provided that no transition to localized corrosion or trans-passive breakdown occurs. In these regimes, the corrosion current may vary in magnitude; however, the cumulative entropy generation remains proportional to material loss, resulting in a constant B coefficient for that degradation regime.
Localized corrosion processes, such as pitting or crevice corrosion, involve highly non-uniform damage and abrupt local increases in current density. These processes introduce multiple competing degradation mechanisms and spatial heterogeneity, which violate the assumption of a single proportional relationship between entropy generation and degradation. As a result, the current formulation of DEG should not be directly applied to localized corrosion without further model development. Accordingly, the DEG approach presented here is best suited for uniform corrosion prevailing under single degradation mechanism, and its extension to localized corrosion represents an important topic for future research.
Data Analysis
Corrosion experiments were conducted on low-carbon steel (LCS 1018), aluminum alloy (Al 6061-T6), and precipitation-hardened stainless steel (PH-SS) to investigate the relationship between entropy generation and corrosion-induced material degradation. For LCS 1018, ten distinct experimental cases were performed by systematically varying the exposed surface area, applied potential, electrolyte temperature, salt concentration, and acid concentration, as summarized in Table 1. The corrosion currents obtained for Cases 1-3 are shown in Figure 2. From Figure 2 it is observed that the magnitude of the corrosion current is increasing with the increase of applied potential, which is expected. The higher corrosion current led to greater electrochemical energy dissipation, resulting in higher entropy generation and correspondingly increased material loss. Despite the broad range of electrochemical and environmental conditions examined, a consistent linear relationship was observed between cumulative entropy generation and material degradation for all tested cases (see Figure 3). This linear behavior demonstrates that corrosion damage scales proportionally with entropy generation, supporting the use of entropy-based metrics for characterizing material degradation across diverse operating conditions. The proportionality constant between volumetric material loss and entropy generation, i.e., the degradation coefficient , was determined for LCS 1018 to be approximately  .
.
| Case | Area of Exposure (mm2) | Applied Potential (V) | Temperature (oC) | Salt Concentration (%) | HCl Concentration (%) |
|---|---|---|---|---|---|
| 1 | 127 | -0.3 | 25 | 3.5 | - |
| 2 | 127 | -0.2 | 25 | 3.5 | - |
| 3 | 127 | -0.1 | 25 | 3.5 | - |
| 4 | 50 | -0.2 | 25 | 3.5 | - |
| 5 | 3.14 | -0.2 | 25 | 3.5 | - |
| 6 | 127 | -0.2 | 25 | 1.75 | - |
| 7 | 127 | -0.2 | 25 | 7 | - |
| 8 | 127 | -0.2 | 25 | 3.5 | 3.5 |
| 9 | 127 | -0.2 | 37.5 | 3.5 | - |
| 10 | 127 | -0.2 | 50 | 3.5 | - |
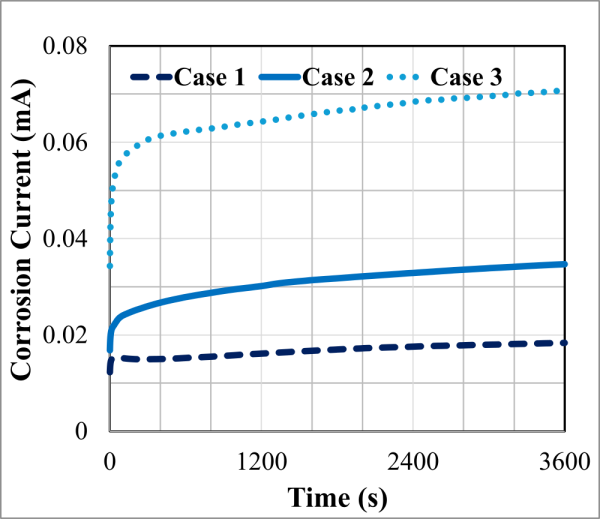 Fig 2. Example corrosion currents measured for Cases 1- 3 in Table 1 [2]. The applied voltage should be held until a steady current is achieved. This current is used in Eq. 6. Here one hour is used, but the duration required to obtain a steady current may vary between experimental conditions.
 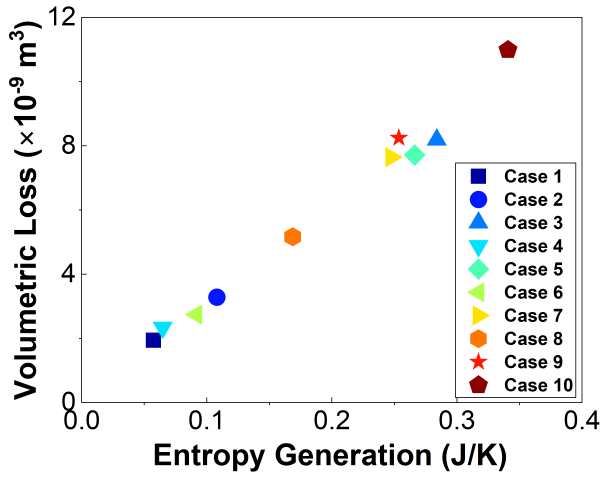 Figure 3. Volumetric wear versus entropy generation for different corrosive conditions.
Similar experiments were conducted on Al 6061-T6 and PH-SS by varying the applied potential, and the corresponding degradation coefficients were determined to be approximately  and
and  , respectively. Comparison of the degradation coefficients indicates that PH-SS exhibits the highest resistance to corrosion-induced degradation, while LCS 1018 shows the lowest resistance among the materials investigated.
The material-specific degradation coefficient provides a direct way to predict volumetric material loss across all environmental and operating conditions. Once is identified by linking entropy generation to experimentally measured volume loss, it can be applied to any new conditions of operation. For any given test, the total entropy produced is computed from the recorded current, applied voltage, and temperature data. Multiplying this cumulative entropy by the corresponding value yields the predicted volume of material lost to corrosion. To demonstrate the predictive power of the degradation coefficient , consider a case where the cumulative entropy generation for LCS 1018 is 0.2 J/K. Using  , the corresponding material loss is predicted to be approximately 6 mm³. This approach remains valid even when the operating conditions vary over time [3].
Can DEG replace polarization resistance measurements (LPR)?
No, it should not replace LPR and the resulting estimate of the polarization resistance (Rp). Instead, DEG should be treated as a complementary technique. First, LPR is considered a non-destructive measurement and can be run multiple times on the same sample (see Rp/Ec Trend in the Gamry Framework). Measuring Rp gives a snapshot of the instantaneous rate of corrosion at any given time, which is ideal for online monitoring. Its strength lies in the simplicity of the test and the robustness of the Stern-Geary equation and the underlying assumption of Butler-Volmer kinetics.
Whereas measuring the degradation coefficient (Eq. 6) is a destructive process, making it highly suitable for accelerated corrosion testing where Rp becomes ambiguous. Once the degradation coefficient is obtained, it is more reliable predictor of volumetric loss across varied conditions. So if you are simultaneously measuring Rp and making weight loss measurements, it may be beneficial to also measure degradation coefficients to reinforce confidence in your corrosion testing pipeline. Though, as mentioned earlier and as is always the case in electrochemical corrosion testing, localized corrosion needs to be controlled. Or at least accounted for in the process of measuring the degradation coefficient.
Conclusion
Entropy generation provides a physically meaningful and unifying metric for corrosion characterization. Using the Degradation Entropy Generation theorem, corrosion damage can be directly linked to the energy dissipated during electrochemical reactions through a single material-specific parameter known as the degradation coefficient, B. This coefficient remains constant for a given material and is largely unaffected by changes in test conditions. For Gamry users, this method fits naturally within standard potentiostatic experiments and does not require additional hardware or complex procedures. By incorporating entropy generation into corrosion analysis, materials can be compared more consistently, accelerated tests can be interpreted more reliably, and corrosion damage can be predicted with greater confidence, complementing traditional electrochemical techniques.
References
1. Bryant, M.D., M.M. Khonsari, and F.F. Ling, On the thermodynamics of degradation. Proceedings of the royal society A: mathematical, physical and engineering sciences, 2008. 464(2096): p. 2001-2014.
2. Lijesh, K., A. Mahmoudi, and M. Khonsari, Experimentally verified thermodynamic framework for corrosion. Corrosion Science, 2024. 233: p. 112063.
3. Koottaparambil, L. and M.M. Khonsari, Entropy-based unified theory of failure threshold of degrading systems. Newton, 2025.
Found this appnote helpful? Let us know on LinkedIn!
https://www.linkedin.com/company/gamry-instruments
Application Note Thermodynamics of Corrosion: Degradation Entropy Generation Rev. 1.0. 2/11/2026.  Copyright 2026 Gamry Instruments, Inc. Interface and Framework are trademarks of Gamry Instruments, Inc.
Want a PDF version of this application note?
Please complete the following form and we will email a link to your inbox!
Categories

