
Introduction to Non-standard Charge-discharge Cycle Tests: Custom Current Profiles
Introduction
Batteries in electric vehicles discharge during acceleration and while maintaining vehicular speed. They are recharged during braking. Driving cycles can therefore reflect significant variations in battery discharging and charging events such that observation of ampere-level current swings may be possible. For example, The US Advanced Battery Consortium (USABC) adapted the Federal Urban Driving Schedule (FUDS) cycle test to electric vehicles and presented it as percent of peak discharge power with time as shown in Figure 1. Negative percentage values refer to a state of discharging whereas positive values refer to a state of charging.
Cyclic charge and discharge (CCD) of batteries is a standard cycling test that Gamry Instruments has implemented into our Electrochemical Energy software. We also have an application note that explains how to run CCD with our potentiostats. In this application note, we consider cycling tests that require more than just constant current, power, or resistance. These tests use a preset current profile to discharge a battery. The current profile is designed to mimic operating conditions that the battery is exposed to in its lifetime. Here we examine the charging and discharging of batteries for electric vehicles, associated with driving cycles such as the EPA Urban Dynamometer Driving Schedule (UDDS). Although we are not testing actual electric-vehicle batteries here, we show results from a standard 18650 Li-ion battery.
To use custom current profiles, run the discharge profile script under electrochemical energy. For details, see our online Framework help article here.
Battery Specification and Setup
Using the cycle from Figure 1, we created a preset current profile shown in Figure 2. This current profile was scaled to operate on our Interface 5000 potentiostat. We ran ten cycles sequentially to ensure that the cell reached the lower voltage limit.

Fig. 1. USABC-FUDS cycle test based on the FUDS emissions test.
 of the current profile used to discharge the battery.")
Fig. 2. First 3600 s (1 h) of the current profile used to discharge the battery.
The current was scaled to a maximum of 5 A, which is compatible
with the Interface 5000 potentiostat.
In addition to demonstrating non-standard cycle testing, we examine temperature monitoring using the built-in ports on our Interface 5000 and Reference 3000 potentiostats. The Reference 3000 includes a Type K thermocouple port shown in Figure Fig. 3. On the Interface 5000, temperature monitoring requires the auxiliary 5000 monitor board that directly connects to the monitor port on the front panel.
The 18650 battery’s specifications we measured are given in Table 1. Ports to the instruments are highlighted in Fig. 3. Connections were made using the scheme shown in Fig. 4. The RTD element (Omega, RTD-1-F3141-60-T) used to monitor temperature was taped to the exterior of the cell. The RTD element is connected through the Interface 5000 Monitor board (Gamry Instruments 990-00401). The monitor board is an accessory that provides BNC connections to auxiliary channels through the front-panel monitor port.
Table 1. Battery Specifications.
|
Capacity |
1300 mAh (nominal) 1250 mAh (standard) |
|
Charging voltage |
4.2 V |
|
Nominal voltage |
3.6 V |
|
Charging current |
0.5 A (standard) 4 A (rapid) |
|
Discharge voltage cut-off |
2.5 V |
|
Discharge current (continuous) |
18 A (maximum) |
|
Internal impedance |
~30 mΩ (1 kHz) |

Fig. 3. Temperature-monitoring ports (circled in red) on the rear of the
Reference 3000 (top) and front of the Interface 5000 (bottom) potentiostats.
, and connections to the monitor board")
Fig. 4. Cell cable connections to the battery (top), and connections to the monitor board (bottom).
Temperature-sensing requires the 5000 monitor board. Reference lead was shorted to ground lead (not shown).
Standard charge and discharge cycle testing
The cell was charged and discharged in constant-current mode. Initially the cell was charged at 4 A up to the charging voltage of 4.2 V, with a voltage finish using a cut-off of 100 mA. This was followed by discharge at 5 A to the discharge voltage cut-off of 2.5 V. A five-minute rest time was added in between. Figure 5 shows the capacity of the cell over a short five-cycle test. Results coincide with the nominal capacity as per testing using constant-current charge and discharge. Cell voltage during discharge was stable across all cycles and typically took 15 minutes to complete.


Fig. 5. Battery capacity and cell voltage estimated across five cycles.
Data labels (top graph) refer to the discharge capacity values.
Fig. 6 shows the battery temperature response during discharge for the first two cycles. During each cycle. battery temperature increases to 40°C from room temperature. This is normal behavior for a discharging battery. However, this type of temperature profile may not reflect the actual temperature variations in a dynamic environment. Fig. 7 shows that in a dynamic environment, the temperature peaks roughly 1°C above the moving baseline. The cyclic response follows the large current draw at the start of each drive cycle, which peaks at ~200 s in Figure 1. The most notable difference when comparing the two temperature profiles is that the final temperature values are separated by over 10°C. This points to the importance of selecting the correct discharge profile for each battery application.

Fig. 6. Cell voltage and temperature response for two cycles.

Fig. 7. Cell voltage and temperature response for five drive cycles scaled to a maximum 5 A discharge current.
The run stops when cell voltage reaches 2.5 V.
Although 5 A is the current limit of the Interface 5000 potentiostat, 5 amperes does not truly stress this battery that is rated up to 18 A maximum discharge current (Table 1). To test the maximum stress on the battery, we turned to our combination Reference 3000 potentiostat and 30k Booster. We scaled our current profile (Fig. 1) to 18 A and ran the same test, with the result plotted in Fig. 8. At 18 A, the battery runs for only one full drive cycle and exceeds the 2.5 V cutoff voltage in the second drive cycle. We saw a sharp 6°C rise in temperature during the large current draw at ~200 s.

Fig. 8. Cell voltage and temperature response for a single drive cycle scaled to a maximum 18 A discharge current.
The run stops when cell voltage reaches 2.5 V.
Finally, for consistency, we calculated the power draw from the data and compared it to the original drive cycle in Fig. 1. The first 300 s are shown in Fig. 9. The measured profile is consistent with what we expected where iR effects become more pronounced at higher currents. For more information on iR-compensation, see our Application Note Understanding iR Compensation.

Fig. 9. Measured peak power against the ideal (Fig. 1).
Only the first 300 s are shown for clarity.
Text file details
The text file contains a single column of numbers that represent the current at each step. The time between each step is specified in the script, defined as the sample period. Stop at conditions can be defined there as well. See Fig. 10 below.
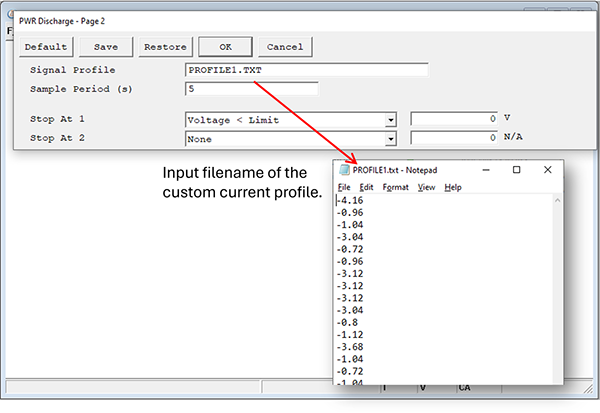
Fig. 10. Screen shot of parameter window of the discharge profile script in Framework.
Want a PDF version of this application note?
Please complete the following form and we will email a link to your inbox!
Categories

