
Electrochemical Impedance Spectroscopy Software is Gamry’s impedance spectroscopy package. This software includes experimental scripts for potentiostatic, galvanostatic and hybrid impedance spectroscopy experiments in addition to single frequency techniques like Mott-Schottky. We also have our unique power-leveling multisine technique that improves signal-to-noise across the spectrum. On the analysis side, it provides tools for fitting spectra to equivalent circuit models, Kramers-Kronig transform for data validation and a graphical model editor. Our software even includes a script for EIS simulation.
Menu
Close
Software
Electrochemical Impedance Spectroscopy Software
Product Details
Overview
The EIS Software allows you to measure impedances spanning 15 orders of magnitude over a frequency range of 10 µHz to 1 MHz!
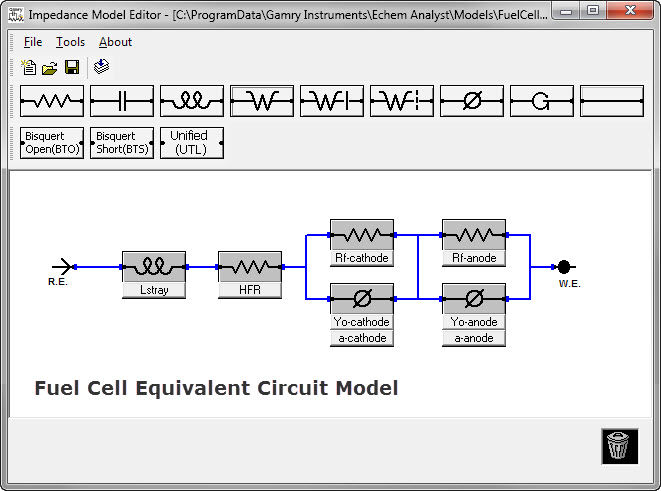
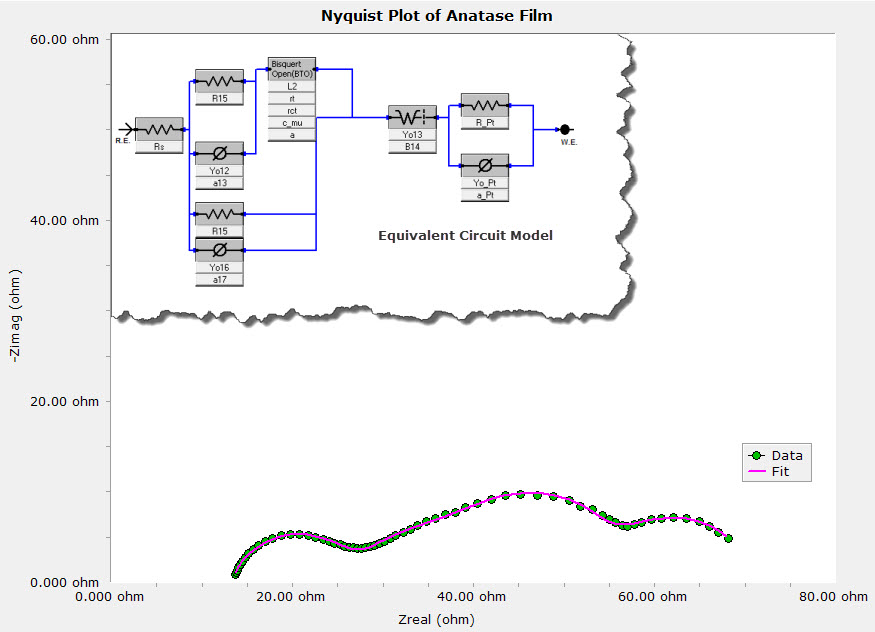
Data analysis in the Echem Analyst is easy. Spectra can be fit to standard cell models or custom models created with our graphical Model Editor.
You can even define your own custom element. If you have a unique model, take a look at our User Defined Components Application Note. We have used this approach to make transmission line elements in collaboration with researchers from Universidad Jaume I.
If you prefer to use your own modeling program, we're happy to help. The data files are compatible with ZView 2 (Scribner Associates), ZSimpWin (Ametek), and Equivalent Circuit (Dr. Bernard Boukamp, University of Twente, The Netherlands).
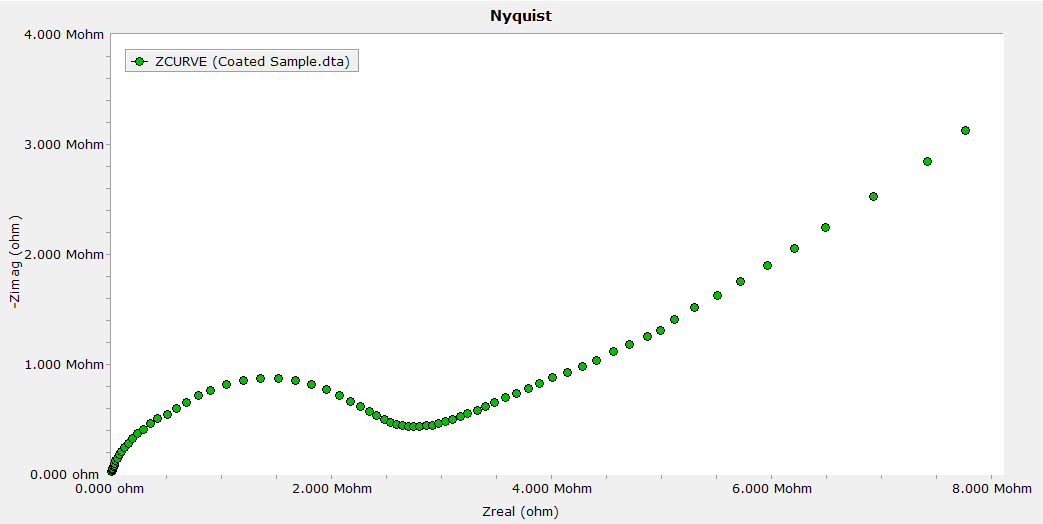
EIS applications include coatings evaluation, fuel cell characterization, battery testing, corrosion rate determination, mechanistic and kinetic studies, and more.
Check out our full line of Electrochemical Impedance Spectroscopy application notes.
Data Acquisition Features
- Continuous AC amplitude and DC offset correction for the most accurate potential and current measurement!
- Lissajous (I vs. E) real-time display at each frequency.
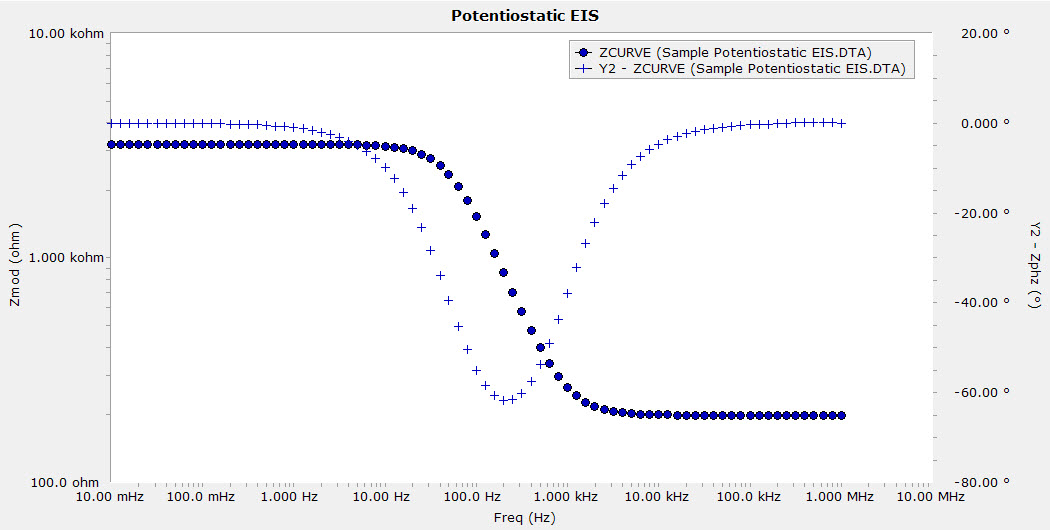
- Bode or Nyquist real-time display of spectrum as it develops.
- Realtime monitoring of signal-to-noise ratio for deciding when a measurement is done for the best data in the shortest time.
Data Analysis Features
- Impedance or Admittance plots.
- Graphic Model Editor for equivalent circuit models with the ability to define custom components.
- Choice of Levenberg-Marquardt or Simplex algorithms in fitting the data to equivalent circuits.
- Kramers-Kronig Transform to evaluate the quality of the EIS data.
- A unique Auto-Fit routine takes the guesswork out of estimating initial values for your model elements.
System Requirements
- Gamry Reference or Interface Family Instrument or other USB-based instrument compatible with the Gamry Framework Software
- Microsoft® Windows™ 10(32-bit or 64-bit) Required, Microsoft® Windows™ 11(32-bit or 64-bit) Recommended
- 16 GB RAM Required, 32 GB RAM Recommended
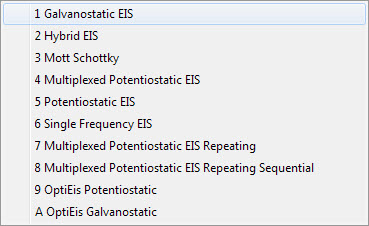
Experiments
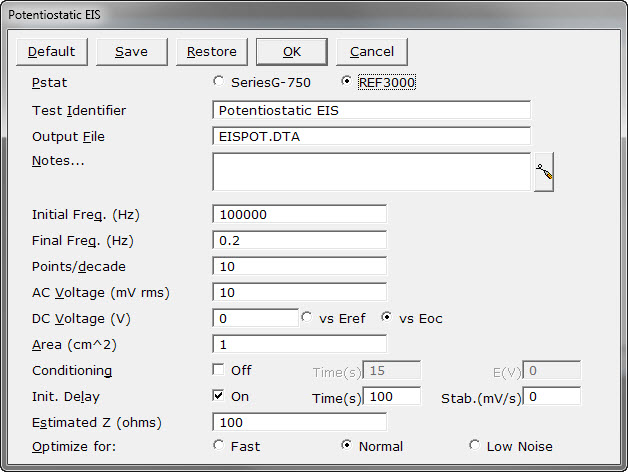
Potentiostatic EIS
Acquires an impedance spectrum over a range of frequencies. The electrochemical cell is maintained under potentiostatic control in either two or three electrode configurations. The operator can control AC voltage, DC offset voltage, starting and ending frequencies, and number of data points measured per decade frequency.
Galvanostatic EIS
Acquires an impedance spectrum over a range of frequencies. The electrochemical cell is maintained under galvanostatic control. The operator can control AC current, DC offset current, starting and ending frequencies, and number of data points measured per decade frequency.
Hybrid Galvanostatic EIS
A variable amplitude version of galvanostatic EIS where the operator specifies the maximum allowed AC voltage amplitude. The software makes smart decisions about the applied current amplitude to maintain the voltage desired. This assures that no excessively high or low values of potential are observed throughout the frequency range. The operator can control AC potential, DC current, starting and ending frequencies and number of data points per decade of frequency.
Single Frequency EIS
A potentiostatic impedance technique where impedance at a constant frequency is measured and plotted versus time. The operator can control the frequency, AC amplitude, DC offset and repeat time.
Mott-Schottky
A discrete step AC voltammogram. The cell's impedance is measured over a range of applied DC voltages at a single frequency. Cell resistance and capacitance (assuming a simple parallel RC and a simple series RC model) are plotted in real time as a function of DC voltage. This test is commonly used for semiconductor and film formation studies, including oxide films on corrosion-resistant materials.
OptiEIS Potentiostatic
The potentiostatic experiment that uses Gamry’s unique multisine implementation, OptiEIS. For details of the algorithms, take a look at our OptiEIS application note.
OptiEIS Galvanostatic
The galvanostatic experiment that uses Gamry’s unique multisine implementation, OptiEIS. For details of the algorithms, take a look at our OptiEIS application note.
Multiplexed Potentiostatic EIS
Runs impedance scans through an ECM8 Multiplexer. This allows the operator to test up to eight samples off of a single instrument, increasing throughput.