
Comprehensive cell impedance measurements using the Interface 5000E potentiostat’s dual electrometer
Introduction
We often hear positive feedback from our users on the Reference 3000 potentiostat with Auxiliary Electrometer (AE). The AE option was designed for users who want to monitor multiple voltage signals synchronized to electrochemical measurements. Four extra cables extended from the front panel of the original Reference 3000 potentiostat, making the AE option a readily identifiable feature. Our Framework Software was also designed to recognize the AE option with our standard scripting. Therefore, from the perspective of the user, the AE option is well known.
In this technical note, we look at the less well-known dual-electrometer feature in our Interface 5000E potentiostat. The dual electrometer allows the user to make a second voltage measurement in addition to the one made by the potentiostat. This is very similar to the AE option of the Reference 3000 potentiostat, with the exception that it uses the pre-existing counter sense (orange) lead to make the second voltage measurement. With no added cables, this feature can be easily overlooked. Effectively, the dual-electrometer feature allows users to make five-electrode measurements.
|
See our Application Note at Gamry.com: |
Setup
Schematically, the dual electrometer is shown in Figure 1. The working electrode (WE) and counter electrode (CE) are the current-carrying electrodes. This is always true in all cell setups with our potentiostats. The working sense (WS), reference electrode (RE), and counter sense (CS) are voltage-sensing electrodes. Using the five-electrode setup, we can measure three independent parameters:
- The cell current, icell
- The cell voltage Vcell, which is equivalent to VWS – VCS
- The half-cell voltages, Vpos and Vneg
a. Vpos is equivalent to VWS – VRE
b. Vneg is equivalent to VCS – VRE
icell, Vcell, and Vpos (or Vneg) are the parameters that allow us to measure the whole cell impedance and each individual half-cell impedance simultaneously using only a single potentiostat!

Figure 1. Electrochemical cell setup for a five-electrode measurement.
WE: working electrode; WS: working sense; RE: reference electrode; CS: counter sense; CE: counter electrode.
We will demonstrate this capability using two physical circuits:
- Gamry AC dummy cell
- Custom electronic circuit
Gamry AC dummy cell:
An AC Dummy Cell (part no. 990-00419) is shown in Figure 2. The front has a pair of five banana jacks (2 mm and 4 mm) to which you connect the potentiostat cell-cable leads. The back shows the RC-R-RC electrical circuit with the traces also visible. This simple circuit approximates the impedance behavior assuming linearity of two electrochemical interfaces separated by an internal resistance.

Figure 2. Front and back of the AC Dummy Cell (part no. 990-00419).
Schematically, the front and back can be overlaid to show where each individual connection is made to the AC Dummy Cell. This is shown in Figure 3. On the AC Dummy Cell, the CS and CE are—ignoring trace resistance—connected to the same node. Similarly, the WS and WE share the same node. Thus, the AC Dummy Cell is not a true four-terminal measurement. In true four-terminal probes such as our battery holders, WS and WE make independent contact with the cell. Using the dual-electrometer mode, we can measure the voltage across the AC Dummy Cell as well as between the CS-RE and WS-RE.

Figure 3. Gamry Instruments AC Dummy Cell diagram.
Table 1. Resistor and capacitor values for Gamry AC Dummy Cell.
| Actual Value | Fitted Value | Form-factor | Tolerance | |
| R1 | 3.01 kΩ | 3.00 kΩ | SM2010 | 1% (±30 Ω) |
| R2 | 200 Ω | 200.9 Ω | SM1206 | 1% (±2 Ω) |
| R3 | 3.01 kΩ | 3.01 kΩ | SM2010 | 1% (±30 Ω) |
| C1 | 1 µF | 0.936 µF | SM1812 | 5% (±50 nF) |
| C2 | 33 nF | 33.2 nF | SM1206 | 5% (±1.7 nF) |
Custom electronic circuit:
A custom electronic circuit was created in a breadboard using basic commercial electronic components. The circuit uses the same diagram as in Figure 3, but it differs in two points: 1) The value of the capacitors and resistors are different (see Table 2 below) and 2) the CS/CE and WS/WE are connected in a true four-terminal configuration.
Table 2. Resistor and capacitor values custom circuit
| Theoretical | Actual | |
| R1 (Ω) | 1000 | 996* |
| R2(Ω) | 220 | 221* |
| R3(Ω) | 1000 | 998* |
| C1 (F) | 3 | 3.098** |
| C2 (µF) | 100 | 97.2* |
Operation
The cables were attached in the AC dummy cell as in the upper photo of Figure 2. In the Custom Electronic Circuit, special attention was placed to separate the current carrying cables from the voltage sensing cables, as explained in the application below.
|
See our Application Note at Gamry.com: |
The impedance for both circuits was collected at the open circuit potential (DC = 0 VOCP) using a Potentiostatic EIS script from Gamry Framework Electrochemical Energy software package. The dual-electrometer mode of the Interface 5000 is selected by clicking “Both” during the initial parameters set up as shown in Figure 4.
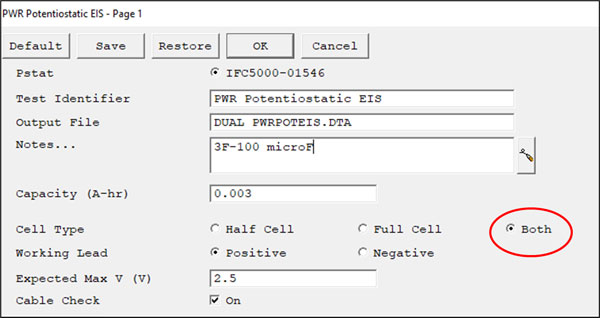 Figure 4. EIS script for Dual Electrometer function.
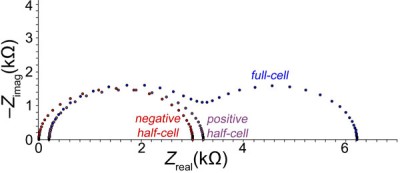
The data are plotted as a Nyquist plot and tabulated in Figure 5 and Figure 6. Three spectra are shown corresponding to the full-cell impedance (R1C1-R2-R3C2), the positive half-cell (R1C1-R2), and the negative half-cell (R3C2). Important to highlight here is that in the case of the custom electronic circuit, the RC time constant of the 1000Ω-3F positive half-cell has a time constant RC=3x10³ which corresponds to a f≈50µHz (The AC dummy cell 3KΩ-1µF positive half-cell has an RC=2x10⁻³ which corresponds to a f≈80Hz).
As expected, the response of both circuits is similar with the only difference in the actual value of its elements. The full-cell impedance response is two partially overlapping arcs shifted to the right of the y-axis. This is consistent with two RC pairs in series with a single resistor. The positive half-cell impedance is a single arc shifted to the right of the y-axis. This is consistent with one RC pair in series with a single resistor. Finally, the negative half-cell impedance is a single arc starting at the origin. This is consistent with a single RC pair.
| Full-cell | Positive | Negative | |
| R1(Ω) | 3000 | 3000 | |
| C1(F) | 9.36 × 10⁻⁷ | 9.32 × 10⁻⁷ | |
| R2(Ω) | 200.9 | 200.2 | |
| R3(Ω) | 3010 | 3010 | |
| C2(F) | 3.32 × 10⁻⁸ | 3.33 × 10⁻⁸ |
| Full-cell | Positive | Negative | |
| R1(Ω) | 948.5 | 933.3 | |
| C1(F) | 2.962 | 2.880 | |
| R2(Ω) | 224.4 | 221.3 | |
| R3(Ω) | 990.9 | 993.2 | |
| C2(F) | 93.81 | 91.5 |
The importance of this measurement is as follows: In dual-electrometer mode, we can separate, identify, and model the impedance elements in each half-cell. The important factor is the position of the reference electrode relative to both the working sense and counter sense leads.
Right away, we can identify some advantages for using the dual-electrometer mode.
- Consistency: The full-cell impedance is always a sum of the half-cell impedance unlike with two or three sequential impedance scans. Drift over time is minimized.
- Time-savings: One impedance scan can yield three sets of impedance data.
- Control: With smart placement of leads, it is possible to isolate and control the impedance elements present in each half-cell impedance spectrum.
As a final sanity check, we should compare the fitted values to the specified values and tolerances of each resistor and capacitor. A quick comparison of the fitted values (Figures 5 and 6) against the nominal values. (Tables 1 and 2) shows that we were successful in measuring the impedance response of the AC Dummy Cell and the custom electronic circuit.
Application Note Rev. 2.0 5/12/2022
Want a PDF version of this application note?
Please complete the following form and we will email a link to your inbox!
Interface 5000 Potentiostat
Dual Electrometers