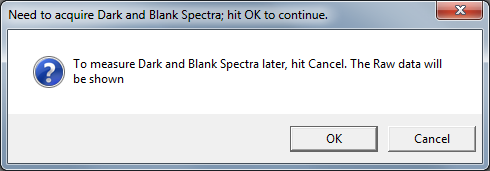
a. If you click the OK button, the Acquire Dark Spectrum window appears.
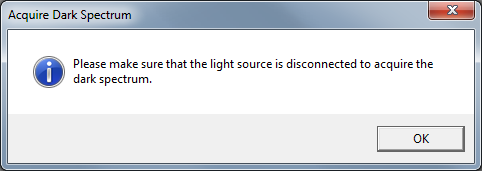
By clicking OK again, a dark spectrum is recorded. The data of the dark spectrum are not saved. The Acquire Blank Spectrum window appears.
![]()
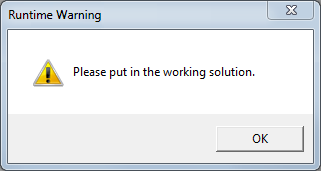
By clicking OK, a blank spectrum is recorded. The data of the blank spectrum are not saved. A Runtime Warning appears.
By clicking OK the actual measurement starts. The previously measured dark and blank spectra are automatically subtracted.
b. If you click the Cancel button, no dark or blank spectra are recorded. For the actual measurement, Raw Counts are measured and plotted versus wavelength.
If Initial Delay is on, the cell is turned off and the specimen's Eoc is measured for the time specified as the Initial Delay time or until the potential stabilizes to a value less than the stability setting. The last measured potential is recorded as Eoc.
A plot of potential versus time is always displayed. A second window for the spectra shows no plot.
If Initial Delay is off, this step is skipped and Eoc is assumed to be 0.0 V vs. Ref.
The script conditions the electrode if Conditioning was specified in the setup. Conditioning is done by applying a fixed potential for a defined time while the cell is turned on. A plot of current versus time is displayed during Conditioning. The window for the spectra shows no plot. No data are saved during this step.
The electrode and the solution are allowed to equilibrate for a defined time. The cell is turned on during this step and the Pre-step Voltage is applied. A plot of current versus time is shown. The window for the spectra shows no plot. No data are saved during this step.
Finally the data are acquired. The spectrometer starts to measure spectra. Charge and current readings at fixed time-intervals (Sample Period) are taken during the steps in Spectro Chronocoulometry. Plots of charge and current versus time are displayed during the steps. For the spectra, either Raw Counts, Absorbance, or Transmittance are recorded and plotted versus wavelength.
The potential of the sample is held at the Pre-step Voltage for the Pre-step Delay Time. This information is stored with the data file and is intended to show that you selected a voltage where no appreciable current occurs. The potential is then stepped to Step 1 Voltage and held at that value for Step 1 Time. The potential is then stepped to Step 2 Voltage and held at that value for Step 2 Time. If Step 2 Time is zero then the second step is skipped.
If you selected Autoranging in the setup, the current range is automatically switched to the optimal range for the measured cell-current at each point. If Positive Feedback IR-compensation has been selected, all data are continuously corrected for IR-drop. If Current Interrupt IR-compensation has been selected, each potential is corrected for the measured IR-drop of the preceding point.