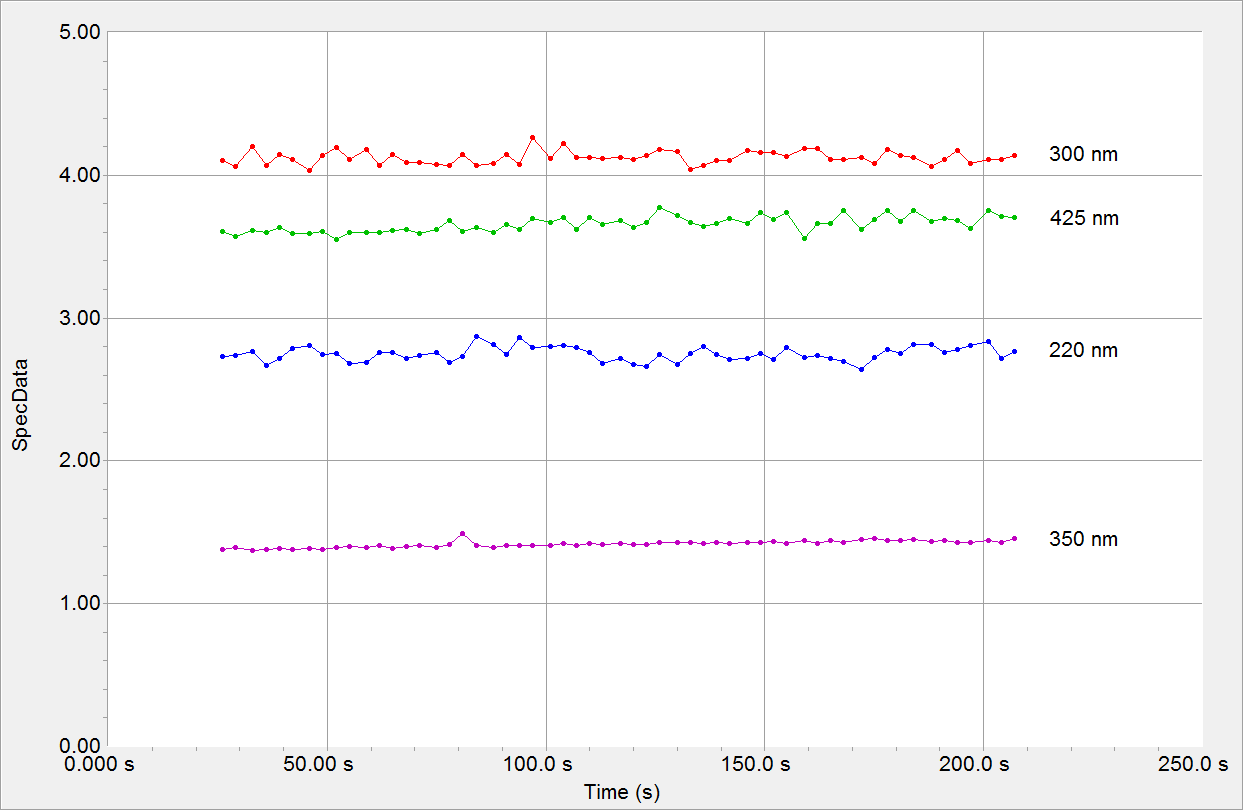
The Add Wavelength Slices command allows you to select four different wavelengths and plot the spectroscopic data (absorbance, transmittance, or raw counts) versus time at the selected wavelengths.
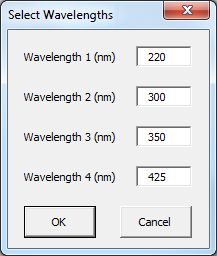
When you select the command, the Select Wavelengths window opens in which you can select four wavelengths.To display fewer than four graphs, enter the value 0 as a wavelength in one of the fields.
After you click the OK button, a new tab opens which shows a diagram with the spectroscopic data plotted versus time for each of the selected wavelengths. Repeating this command adds a further set of plots to this graph.