Optical Spectroscopy Pages

The standard optical spectroscopy analysis contains the following pages at startup:

Spectroscopy

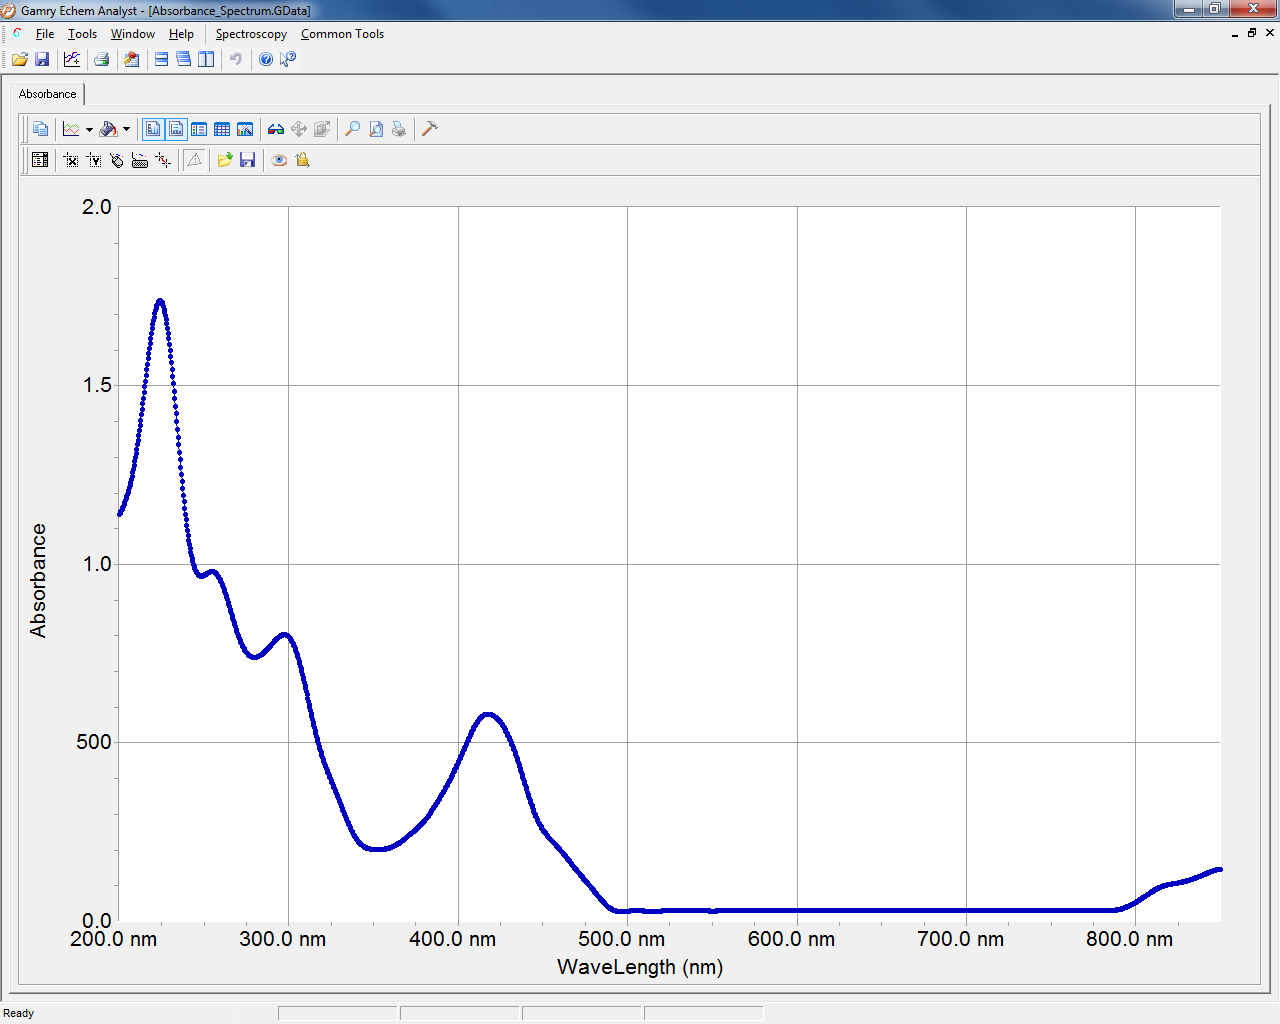
The spectrum measured during an experiment is displayed. Data show either absorbance A, transmittance T, or raw counts plotted versus wavelength λ. Typical commands for spectroscopic experiments can be found in the menu bar under Spectroscopy. This includes Subtract Spectrum, Calculate Absorbance, Peak Find, Clear Peaks, and Add Wavelength Slices.

Additional Pages Which May Become Visible

Wavelength Slices

A graph showing up to four plots of spectroscopic data (absorbance, transmittance, or raw counts) versus time t at the selected wavelength. Using the command Add Wavelength Slices again adds another set of plots to the graph.

Spectro Peak Locations

A grid of peak locations and magnitudes. Using the command Peak Find again adds new lines of peak data.